Check your Levels
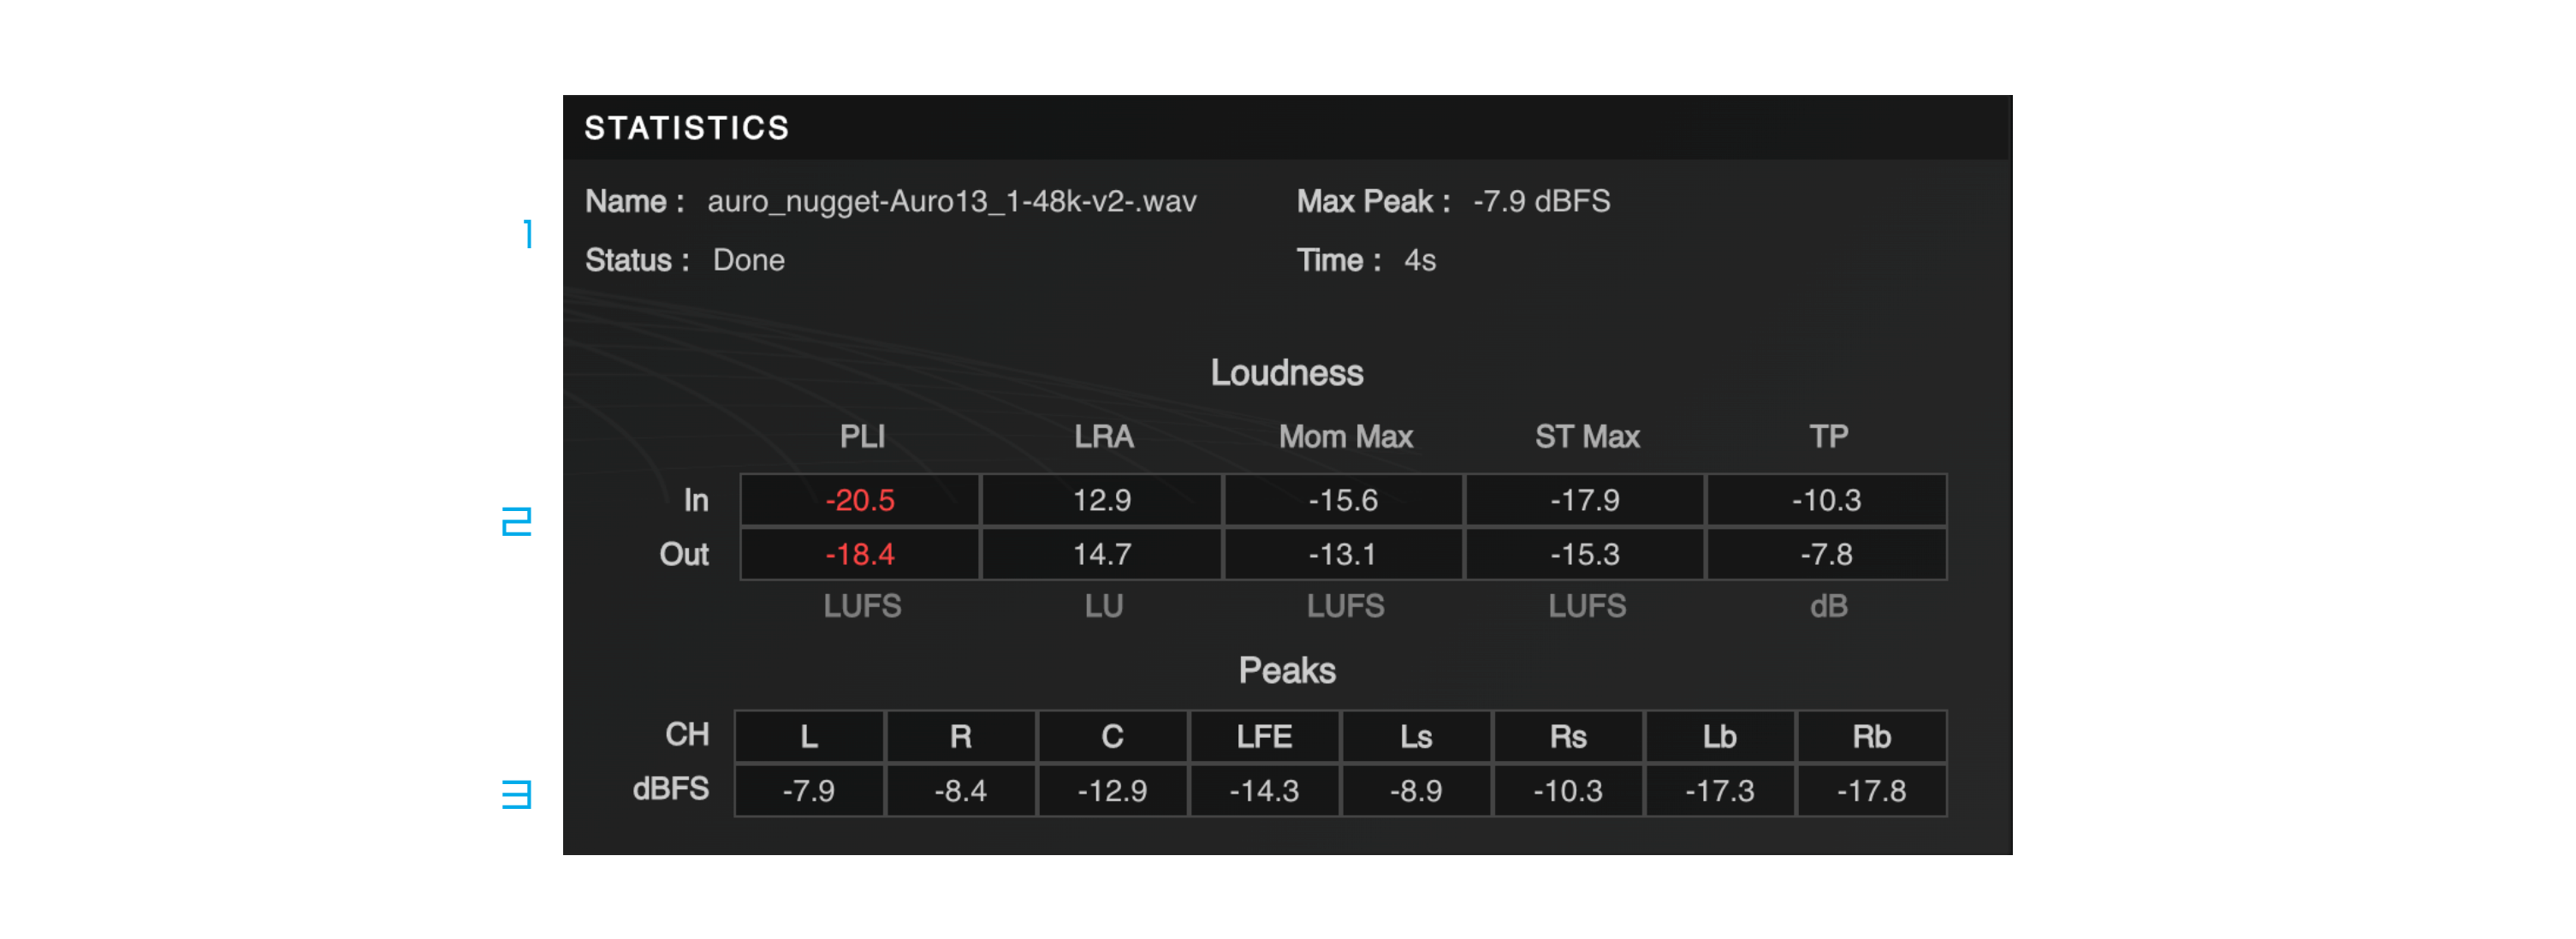
The Statistics Panel in the audio encoder software provides valuable information in three main categories. Firstly, the General Info section displays essential details about the encoding session, including the name of the session, the time that has been taken for encoding, and the current status of the encoding process. This allows users to quickly assess the progress and status of their encoding tasks.
Secondly, the Loudness Table provides comprehensive measurements for loudness, which may include loudness levels such as integrated loudness, short-term loudness, and momentary loudness. These measurements help users ensure that their encoded audio conforms to desired loudness standards or specifications, such as broadcast loudness requirements or streaming platform loudness recommendations.
Thirdly, the Peak Table displays the peak levels for each channel of the encoded audio. This information helps users identify any potential peak level issues, such as clipping or distortion, which may affect the audio quality or cause audio artifacts.
The Statistics Panel serves as a valuable tool for users to monitor and analyze the audio encoding process, allowing them to make informed decisions and adjustments to achieve desired audio quality and compliance with loudness standards or specifications.

Figure 3 – 6 | Statistics Panel Ovwerview
1. General Information
The general information includes:
• Name: The name of the encoding session, which has been customized by the user to easily identify and differentiate between different encoding tasks.
• Status: The current status of the encoding process, indicating whether it is in progress, completed, paused, compromised or stopped.
• Max Peak: The maximum peak level detected in the encoded audio, providing information on the highest amplitude reached during the encoding process. This helps users identify potential peak level issues that may affect audio quality or cause audio artifacts.
• Time: The time that has been taken for the encoding process to complete, providing an indication of the duration required for the audio file to be encoded.
2. Loudness Table
The Loudness Table provides comprehensive measurements of various loudness parameters for the selected session, both before and after the encoding process. These measurements may include Integrated Loudness (LUFS), Short-term Loudness (LUFS), and True Peak (dBTP) among others. The color-coded display highlights any values that are not compliant with the EBU-R128 recommendation, with red indicating potential issues. This allows users to quickly identify and address any loudness inconsistencies that may impact the quality and compliance of the encoded audio file. The Loudness Table provides valuable insights into the loudness characteristics of the audio file, enabling users to optimize the loudness levels and ensure compliance with industry standards for broadcast or distribution purposes. The following are the units of measurement:
• Program Loudness Integrated (PLI): This measures the integrated loudness of the program content, indicating the overall loudness level.
• Loudness Range (LRA): This measures the dynamic range of the program content, indicating the difference between the loudest and softest parts.
• Momentary Max (Mom Max): This measures the maximum loudness level of short-duration moments in the program content.
• Short-Term Max (ST Max): This measures the maximum loudness level over a short-term period in the program content.
• True Peak (TP): This measures the maximum peak level of the audio signal, accounting for inter-sample peaks.
3. Peaks Table
The Peak Table provides measurements of the peak level for each encoded channel separately, expressed in dBFS (decibels Full Scale). This feature is particularly useful in detecting unexpected peaks of energy in specific channels of the audio file. By displaying the peak levels of each channel individually, users can identify any outliers or irregularities in the audio signal that may affect the overall quality of the encoded file. This information empowers users to fine-tune their encoding settings or make necessary adjustments to avoid clipping, distortion, or other undesirable audio artifacts caused by peak levels exceeding the recommended threshold. The Peak Table serves as a valuable tool for ensuring optimal audio quality and maintaining the integrity of the encoded audio files.l


